The right tools to solve problems
02-11-2019
How do you solve problems? For most engineers, it's at the heart of what we do, providing working solutions to interesting problems. And to solve problems, we need tools to measure, to allow us to analyse and process and refine. This applies mostly to hardware projects, with oscilloscopes and logic analysers and even the simple voltmeter coming into play. What is interesting is the same techniques apply to software, as we recently discovered.
We routinely use databases, whether large SQL databases on large servers or small lightweight databases on small embedded systems, like Redis or Influx. Understanding their internal workings and using them efficiently is of great interest, especially on compact, low power embedded systems.
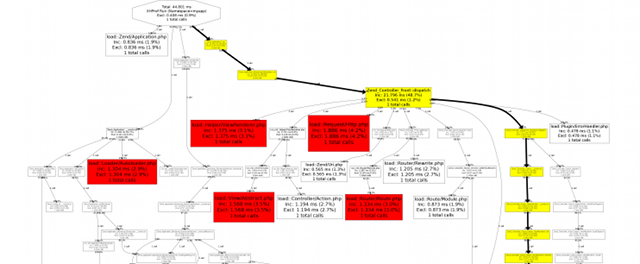
We asked Dave, one of our software developers to explain how code profiling aids in breaking down complex problems into manageable parts, using GraphViz as a means of visual representation. Using this technique, we were able to reduce server requests from one of our functions checking timezones 200,000 times, down to just 70.
"Code profiling is generally used to analyse the sequence of instructions or function calls in code, along with time and memory usage characteristics. It's an extremely useful process for figuring out how to optimise or improve code to be more efficient with the resources it uses.
Profilers use a wide variety of of techniques to collect data, such as hardware interrupts, performance counters etc. They are essential for understanding program behavior. Software developers need tools to analyze their programs and identify critical sections of code.
For example, when a program stores or uses information kept in a database, the act of 'transacting' information from that database (storing or retrieving data) takes both time and computing resources to complete. If a program is inefficient with the type of calls it makes to a database or makes them too often, the program can take too long or can 'hog' system resources unnecessarily. Profiling our code helps us understand where this takes place and how we can redesign or rewrite our code to avoid inefficiencies.
Internet of Things (IoT) based systems that store and process information at a regular interval can generate vast amounts of data. If an instrument records a data point once a minute, 2 year's worth of data will consist of over a million data points! Figuring out how to process and manage that information is key to maintaining large systems of data and profiling our code helps us do it efficiently and quicker."
If you're interested in profiling, we based our implementation on the
fantastic
Lorenzo Alberton, who has many intricate articles covering all sorts of tutorials, talks
and think pieces.